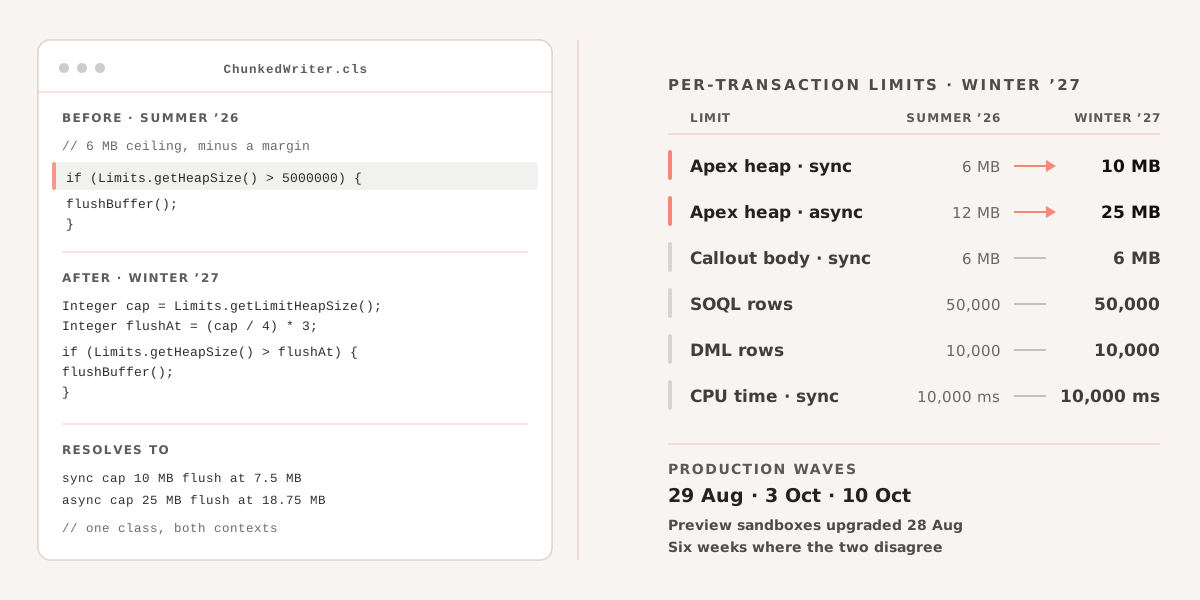
Wave one of Winter ’27 went to production on 29 August. If your org was in it, the synchronous Apex heap ceiling moved from 6 MB to 10 MB two days ago, and none of your code knows.
Most orgs were not in wave one. They go on 3 October or 10 October. Sandboxes on the preview instances upgraded on 28 August. So for roughly the next six weeks a lot of teams sit in the position where the sandbox they test in and the org they deploy to enforce different heap limits, and the gap is four megabytes.
What actually changed
Two numbers, and that is the entire change: synchronous transactions go from 6 MB to 10 MB, asynchronous from 12 MB to 25 MB.
No new methods. No new exception type. Nothing to opt into — the higher ceilings come with the release. System.LimitException: Apex heap size too large simply fires later than it used to.
There is one control, a checkbox in Apex Settings named “Enforce the Summer ’26 Apex heap limit”, which holds the old numbers in place. It exists so a preview sandbox can behave like a production org that has not upgraded yet. It is explicitly temporary: once every instance is on Winter ’27 there is nothing left for it to do, and it goes.
The number that did not move is the interesting one
The maximum size of an HTTP callout request or response in Apex is 6 MB synchronous and 12 MB asynchronous. Those figures are not a coincidence. They were set to match the heap limit, because a callout body counts against heap the moment it arrives.
Which meant the documented 6 MB ceiling was, for years, fiction. Pull a 6 MB response in a synchronous context and you had spent the whole heap holding a string you had not looked at yet. JSON.deserializeUntyped on that string needs room for the string and the object graph at the same time, so the practical ceiling was far lower than the published one. Ask anyone who has tried to accept a bulk payload from a partner endpoint in a single sync callout. The number they landed on was somewhere under 2 MB, and they got there by bisection rather than by reading a limits page.
Now the body cap is still 6 MB and the heap is 10 MB. That is four megabytes of room to parse in. Asynchronously it is better: a 12 MB body against a 25 MB heap leaves you thirteen megabytes of working space, which is the first time that limit has been usable as documented.
So the headline is not “we can hold more records now.” It is that a callout size Salesforce has published for a decade finally fits inside the transaction that has to consume it.
Your constants are wrong in the safe direction
Large-data Apex is full of lines like this one:
if (Limits.getHeapSize() > 5000000) {
    flushBuffer();
    buffer.clear();
}
Five megabytes, picked because six was the ceiling and you wanted a margin for the flush itself. On a Winter ’27 org that guard fires with almost half the budget unspent. Nothing breaks. You just do twice the DML you need to, in a job that was already the slowest thing in the nightly window.
The fix is to stop writing the number down:
public class ChunkedWriter {
    private static final Integer HEAP_CEILING = Limits.getLimitHeapSize();
    private static final Integer FLUSH_AT = (HEAP_CEILING / 4) * 3;

    private List<SObject> buffer = new List<SObject>();

    public void add(SObject row) {
        buffer.add(row);
        if (Limits.getHeapSize() > FLUSH_AT) {
            flush();
        }
    }
}
Limits.getLimitHeapSize() returns the ceiling for the transaction you are currently in, so the same class gets 10 MB when a controller calls it and 25 MB when a batch does. Apex statics initialise once per transaction rather than persisting between them, which is usually a nuisance and here is exactly what you want. The constant resolves fresh against whichever context is running.
Three quarters is a starting point, not a law. If a single element in your buffer can be a megabyte, leave more room.
The six weeks where two orgs disagree
Here is the failure mode that will cost someone a Tuesday.
A batch job peaks at around 18 MB of heap. It passes in the preview sandbox, because the preview sandbox upgraded on 28 August and allows 25 MB. It is deployed to a production org in wave three, which is still on Summer ’26 and allows 12 MB. The job dies. The diff contains nothing that touches memory, because the diff is not what changed — the ceiling under it is.
That is the entire reason the compatibility checkbox exists, and the mitigation is two lines of runbook:
- Find your production org’s upgrade date. Setup → Company Information gives you the instance name; the Salesforce Trust status page gives you the date for that instance.
- Until production has passed it, tick “Enforce the Summer ’26 Apex heap limit” in every sandbox that has upgraded ahead of it. Untick it the week after production goes.
Sandbox refresh timing catches people here too. A full copy sandbox refreshed before the production upgrade comes back on the old ceiling; refreshed after, it comes back on the new one. Two sandboxes off the same production org can disagree with each other, on the same day, for a reason nobody wrote down.
What did not move
More heap does not mean more of anything else. Still 50,000 SOQL rows per transaction. Still 10,000 DML rows. Still 100 SOQL queries synchronously, 10,000 ms of CPU time synchronously and 60,000 ms asynchronously.
The row limit and the heap limit have always bound in different places, and they now bind further apart. Selecting Id, Name on 50,000 rows was never a heap problem. Selecting forty populated fields on 50,000 rows is not going to fit in 10 MB and did not fit in 6 MB either, so the code that hit SELECT ... LIMIT 50000 and fell over on memory still falls over on memory. It just does so a bit further along.
Where the heap actually goes
Three places account for most of the heap exceptions we get called about, and none of them is “we queried too much”.
String building in a loop. csv += row + '\n' allocates a new string on every pass and the old one stays resident until it is collected, which Apex gives you no way to request. Building a four megabyte export this way peaks well above four megabytes. Collect into a List<String> and call String.join(rows, '\n') once. This has always been the advice and the bigger ceiling has not retired it, it has only raised the size at which you find out.
Stateful batch instance variables. Fields on a Database.Stateful batch are serialised at the end of each chunk and restored at the start of the next. A Map that accumulates across chunks therefore begins every execute() already occupying heap, and grows. The exception lands on chunk 340 of 500, three hours into a run, which is the worst possible place for it to land and the reason these bugs survive so long in production. Extra headroom moves that number. It does not change the shape of the curve.
Statics that are caches. A Map<Id, Account> parked in a static to avoid re-querying stays resident for the whole transaction, including every trigger re-entry that follows. That is the point of it. It is also heap you never get back, and on a bulk update of 200 records with a deep automation chain, it is frequently the largest single thing in the transaction.
What to do this week
Find the constants first, because they are the cheap part. Something in this shape will get most of them:
grep -rnE "getHeapSize\(\)|[0-9]_?[0-9]{6}" force-app/main/default/classesYou are looking for six- and seven-digit literals near a heap check, and for getHeapSize() compared against anything that is not getLimitHeapSize(). On a mature org this is usually a dozen sites in four or five classes, most of them written by the same person in the same week.
Then set the sandbox checkbox, if production has not upgraded yet. Then raise batch scope, if you were holding it at 200 for memory reasons rather than for CPU reasons, and measure rather than assume.
The heap increase is a genuinely good change and it costs you nothing to receive. The risk is not in the new limit. It is in the six weeks where two orgs you own enforce different ones, and in the constants that were true in July.
If you have Apex written around the old ceiling and nobody remembers where the constants live, that sweep is the kind of thing our Salesforce consulting and support and managed services work covers. Get in touch if you want a second pair of eyes before your instance’s date, or read our note on analysing Apex offline if you would rather find them in a pre-commit hook than in a batch log.